Ahmad yaser faiq
📄 Ahmad Yaser - Data Analyst Portfolio
👤 Personal Profile

Welcome to my Data Analyst Portfolio, where I showcase interactive dashboards and analytical projects created using Excel, Power BI, SQL, and Python.
My background in accounting combined with strong analytical skills allows me to extract insights from raw data and visualize it effectively for decision-making.
📌 Featured Projects
| Project | Description | Link |
|---|---|---|
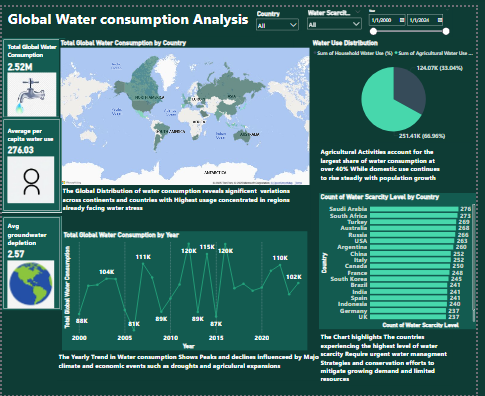
| 💧 Water Consumption Analysis | Analyzes global water usage, scarcity, and trends over time. | View Project |
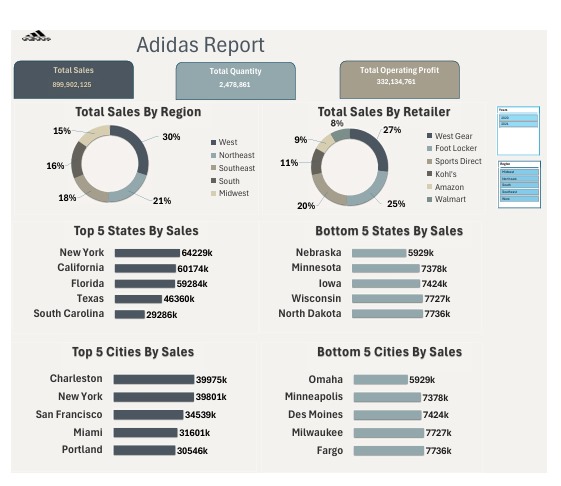
| 📊 Adidas Sales Dashboard | Sales performance breakdown by region, state, and retailers. | View Project |
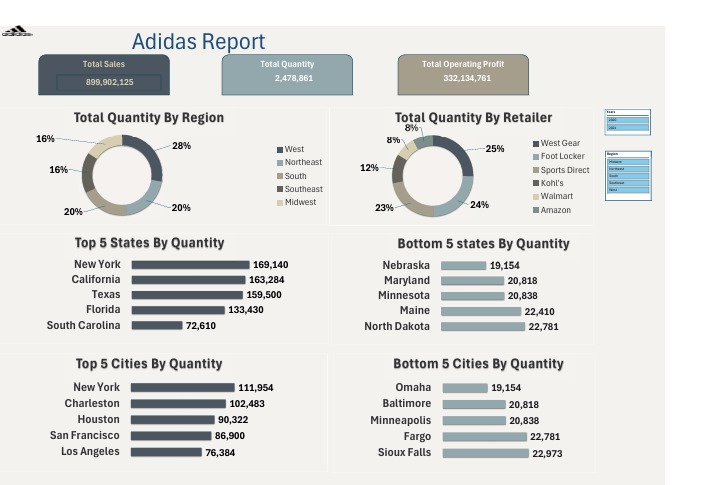
| 📦 Adidas Quantity Analysis | Visual insights into product quantity and performance gaps. | View Project |
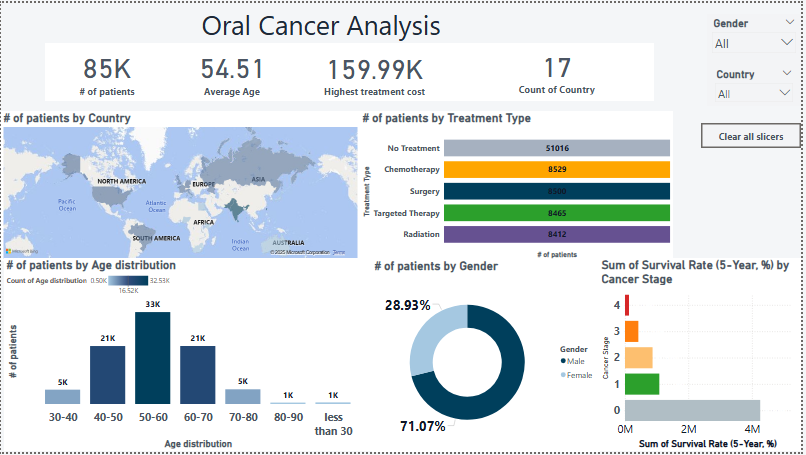
| 🧬 Oral Cancer Analysis | Patient demographics, treatments, and survival data. | View Project |
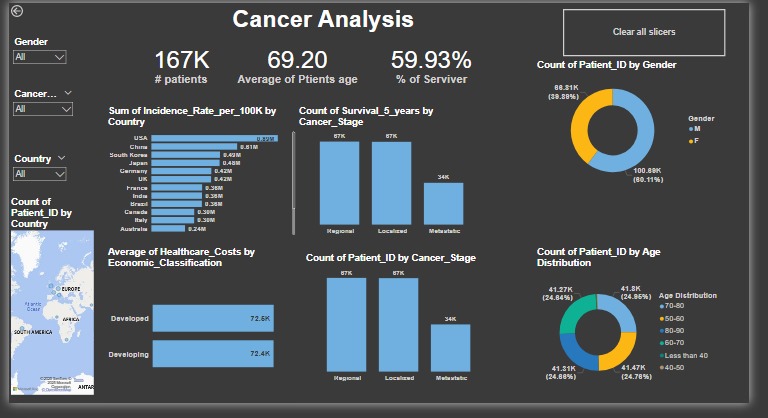
| 🩺 Cancer Dashboard | Country-wide cancer data and trends by age and gender. | View Project |
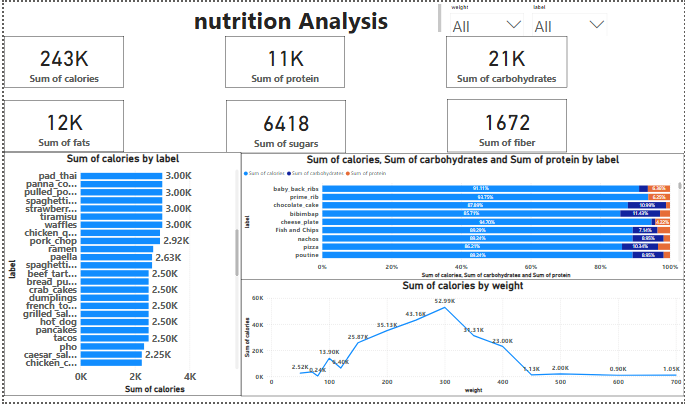
| 🥗 Nutrition Analysis | Nutritional breakdown of food items and caloric distribution. | View Project |
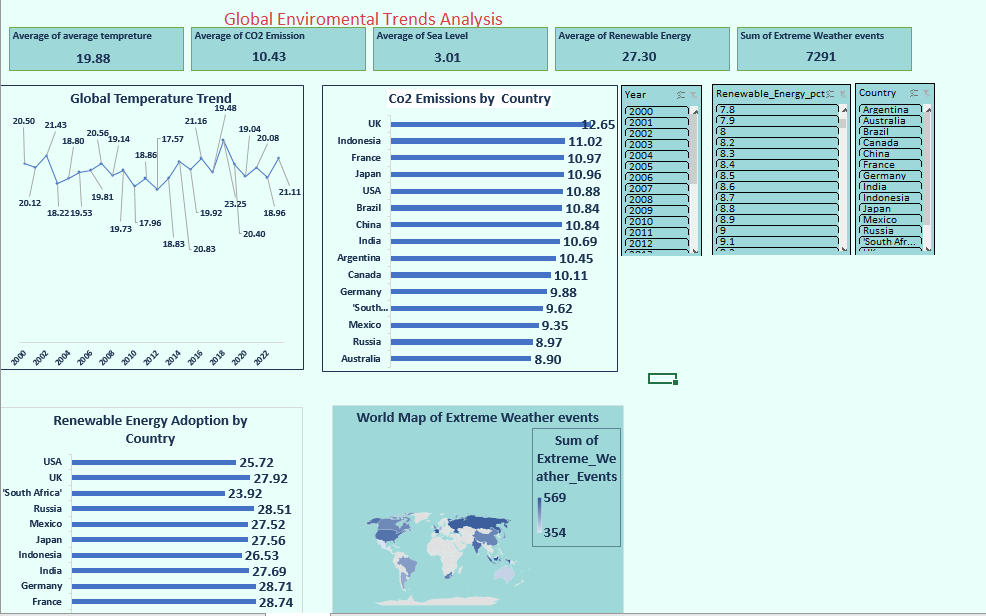
| 🌍 Environmental Trends | Global climate data including CO₂, sea levels, and energy use. | View Project |
🔧 Tools & Skills
- Power BI – Dashboard creation and data storytelling
- Excel – Pivot tables, charts, cleaning
- SQL – Data extraction and joins
- Python (pandas, matplotlib) – Data manipulation and visualizations
- GitHub – Version control and project sharing
- HTML/CSS – Personal portfolio design
🖼️ Portfolio Screenshots
You can preview selected dashboards directly in the portfolio or via the GitHub pages if hosted.
📊 Adidas Sales Dashboard
📦 Adidas Quantity Analysis
🧬 Oral Cancer Analysis
🩺 Cancer Dashboard
🌍 Global Environmental Trends
🥗 Nutrition Analysis
💧 Water Dashboard
📬 Contact
- 📧 Email: ahmadyaser17199813@gmail.com
- 💼 LinkedIn: linkedin.com/in/ahmad-yasser-faiq-data-analyst
- 🖥️ GitHub: github.com/ahmadyase1234
- 📱 Phone: 01094104923 / 01555313788
- 👉 Live Portfolio: Click Here to View Online